
Every year we all hope for or hate the idea of snow over Christmas I thought we would look at snowfall data for the UK, apologies to all my international readers. The data is on a web page in small tables that need appending together ready to be put into a simple report in Power BI Desktop.
Consuming the Data Source
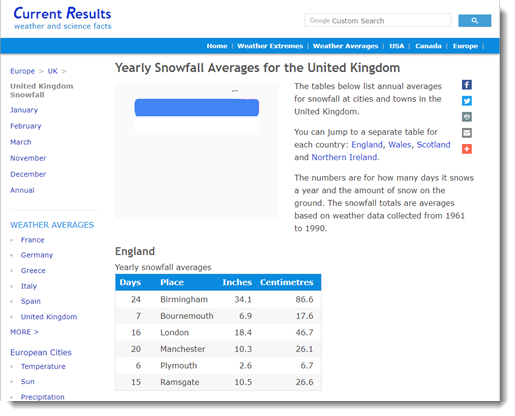
The data I found is a page that contains 4 tables of snow data. They are all constructed with the same 4 columns which make combining them into one table very easy. The website URL is
https://www.currentresults.com/Weather/United-Kingdom/snowfall-annual-average.php
Combining Web Tables
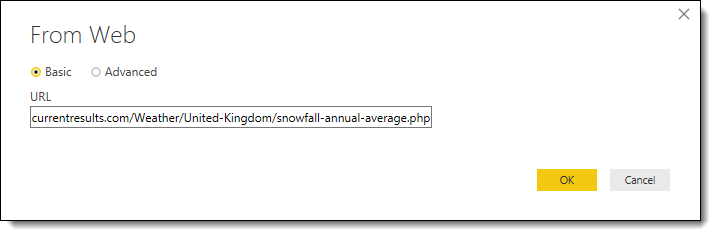
Step 1: In Power BI Desktop, click Get Data on the Home tab.
Select Web and enter in the URL from above and click OK.
Step 2: In the Navigator dialog that appears next, select all the tables except Document and then click Edit.
The document contains the complete html of the web page and is not needed for this example.
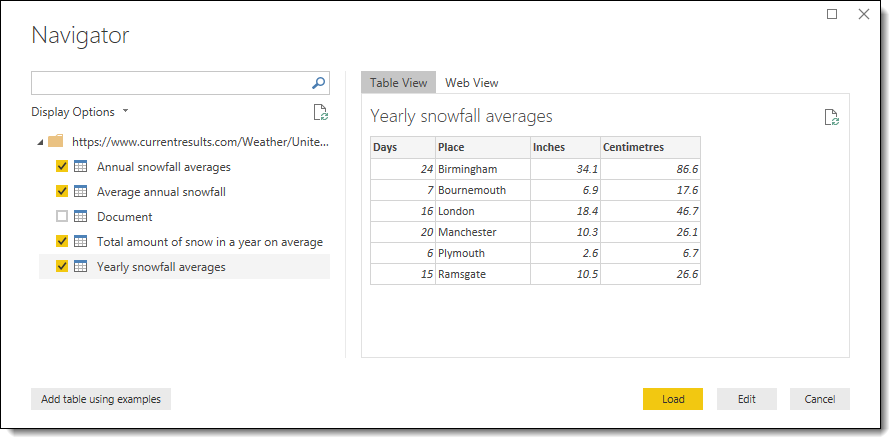
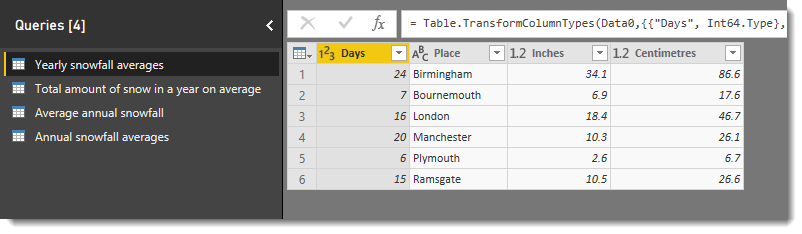
This creates 4 queries, one for each table.
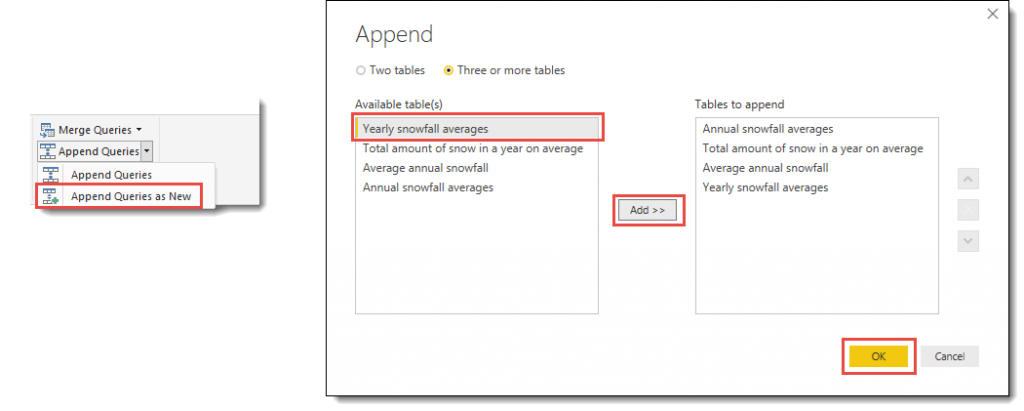
Step 3: The next step to append the queries together to make a new query.
- From the Home ribbon, select Append Queries – Append Queries as New.
- Add each query to the list to append by clicking the name and then Add>>
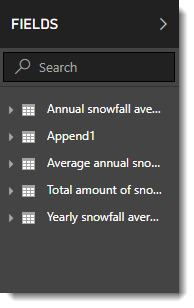
- When all four have been added click OK to create your new query, Append1
Step 4:On the home ribbon, click Close & Apply to load the data into the report.
Removing Un-required Queries
The previous stages have created the Append1 query which contains the data we want, but also the queries that were used to make Append1. Those queries you don’t need so we do not need to load them into the report.
Step 1: On the home ribbon in Power BI desktop, click on Edit Queries to return to Power Query.
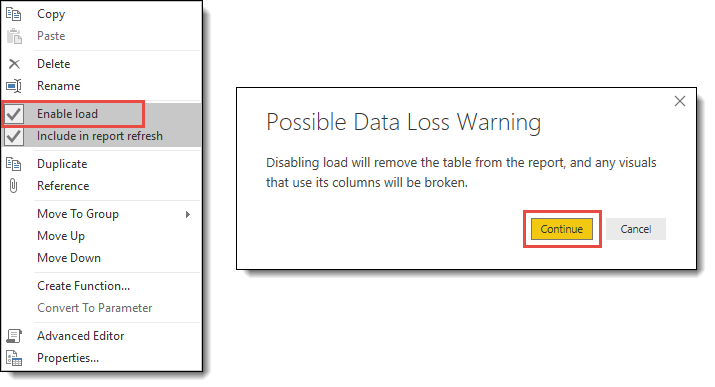
Step 2: Right-click on each unrequired query and untick Enable load.
- Power Query will warn you this might break you report if you used this query.
- Click on Continue to change stop the query being loaded.
Step 3: Repeat for the other queries and then click Close & Apply again.
Only the final query Append1 should now be loaded, which of course should be renamed to something more relevant.
Conclusion
This example although very simple shows how data on a web page can be used to populate a report. It does depend upon the web page keeping the same structure, so this risk does need to be considered.
Extra Note
For those of you who prefer a single query and are willing to do some M editing here is the same data from the same source but a single query.
let
// Load the web page
Source = Web.Page(Web.Contents("https://www.currentresults.com/Weather/United-Kingdom/snowfall-annual-average.php")),
// Load the 4 tables
Data0 = Source{0}[Data],
Data1 = Source{1}[Data],
Data2 = Source{2}[Data],
Data3 = Source{3}[Data],
// Combine the 4 tables
CombineData = Table.Combine({Data0,Data1,Data2,Data3}),
// Column data types
SnowData = Table.TransformColumnTypes(CombineData,{{"Days", Int64.Type}, {"Place", type text},
{"Inches", type number}, {"Centimetres", type number}})
in
SnowData
