
If you’re new to Excel and want to know more about how it works, what you can achieve, or simply check that you know about all of the available features, then why not take the official Excel tour.
The basic tour includes the following 10 topics, each covered on an individual worksheet within the tutorial workbook
- Add
- Fill
- Split
- Transpose
- Sort & Filter
- Tables
- Drop-downs
- Analyze
- Charts and
- Pivot tables
Each worksheet contains an explanation of the function, examples that you can try to complete yourself and links for additional information at the bottom, it’s a great place to start your journey with Excel.
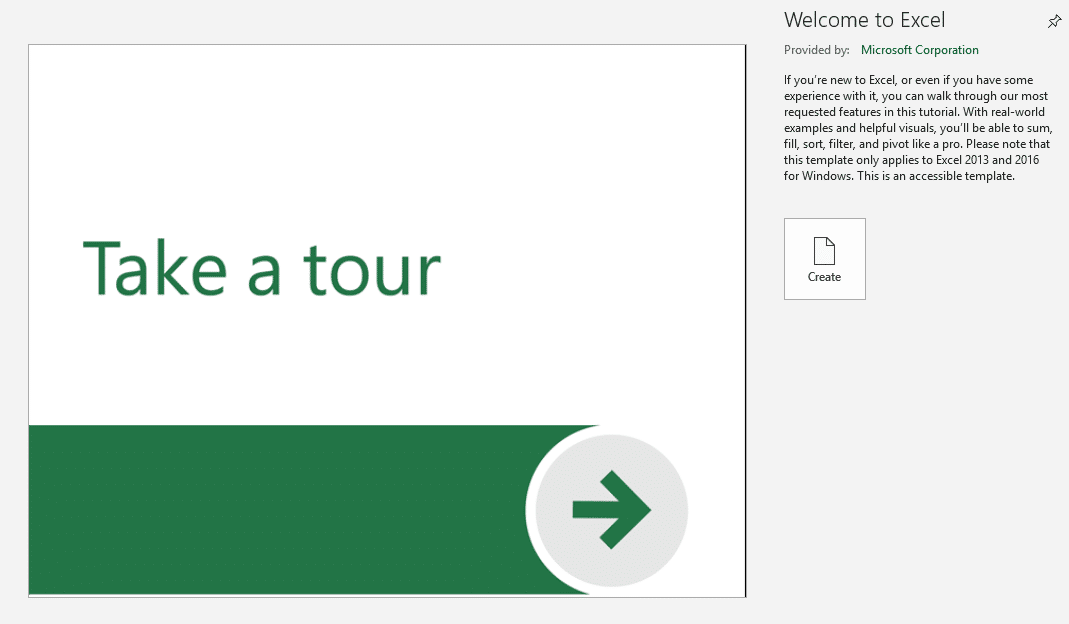
The Excel tour (along with some other useful tutorials) is available as an option when you try to open a new file.
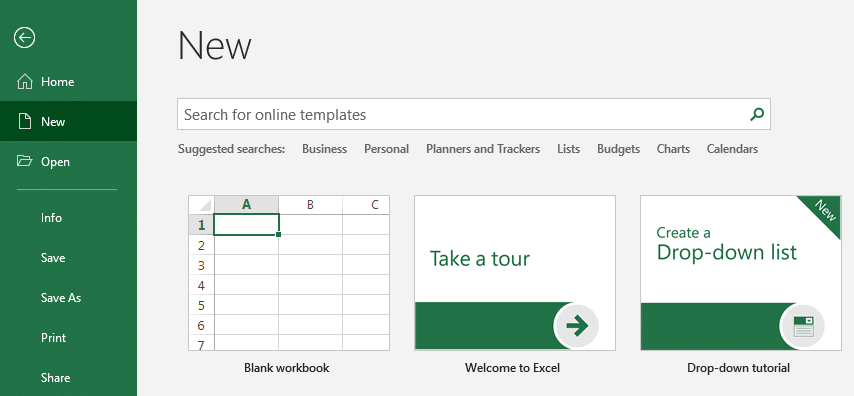
Click on the ‘Take a Tour’ tile and then ‘Create’
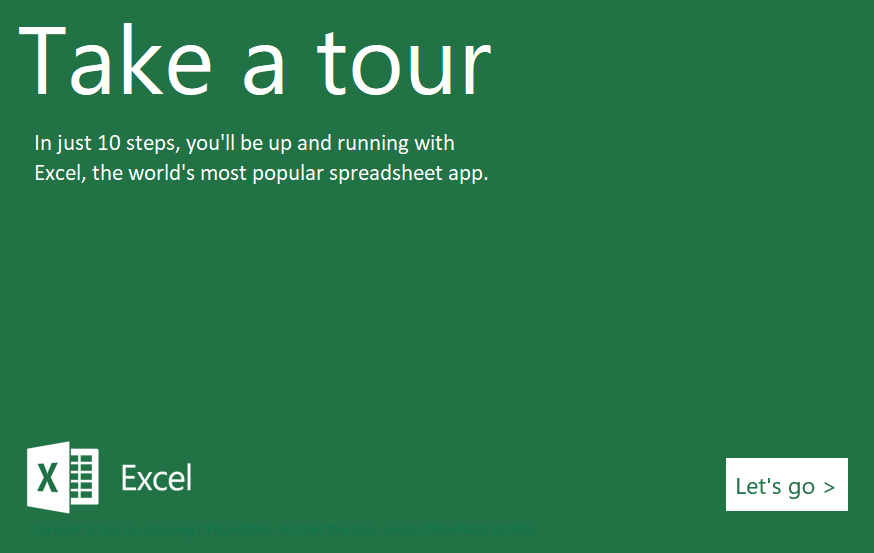
This will open up a really useful, pre-created Excel workbook that you can work through, click the “Let’s go” button to move to the first worksheet
- Add: This sheet explains several ways to add numbers, using AutoSum and keyboard shortcuts. The SumIf function is also introduced.
- Fill: If you’ve never used the awesome time-saving autofill function, then this is explained on worksheet 2. With series fill you’ll never need to type all of the months of a year again, just type ‘Jan’ then click and drag to auto-complete the remainder of the year.
- Split: This shows how to split data contained in one cell into several others. For example you may want to take an email address and extract a first name, surname and domain address into separate cells.
- Transpose: Turning horizontally presented data into a vertical format can be achieved using the transpose option.
- Sort and Filter: You probably know that data can be sorted alphabetically or numerically, but did you know you can also sort by colour? Adding filters to a table of data can help you find items that meet certain criteria.
- Tables: Organising data into formalised tables provide additional ways to gain special features. The tutorial includes how to create calculated columns.
- Drop-down list: If you’re looking to simplify (and standardise) data entry then creating and using drop-down lists are a great way to limit the options used. Using the tables features you’ve learned about on the previous sheet is generally considered best practice so helps you cement that new found knowledge.
- Analyse: This sheet focuses on creating charts from data to visualise the information more easily
- Charts: The horizontal and vertical axes of charts along with secondary axes are explained in more details here.
- Pivot tables: finally pivot tables are explained and showcased on the last sheet
Similar tutorials are also available from the ‘File’, ‘New’ option in Excel

If you’d like to expand your Excel knowledge and take your skills to a whole new level, why not attend the Excel and Power BI Summit (3-5th December) It’s free to attend on these dates, with additional passes available for anyone who can’t make it or who would prefer to watch the sessions at another time. The agenda can be found here: https://content.collab365.com/collab365-excel-power-bi-summit/register-excel-powerbi-summit-2019/

